Find the first fault.
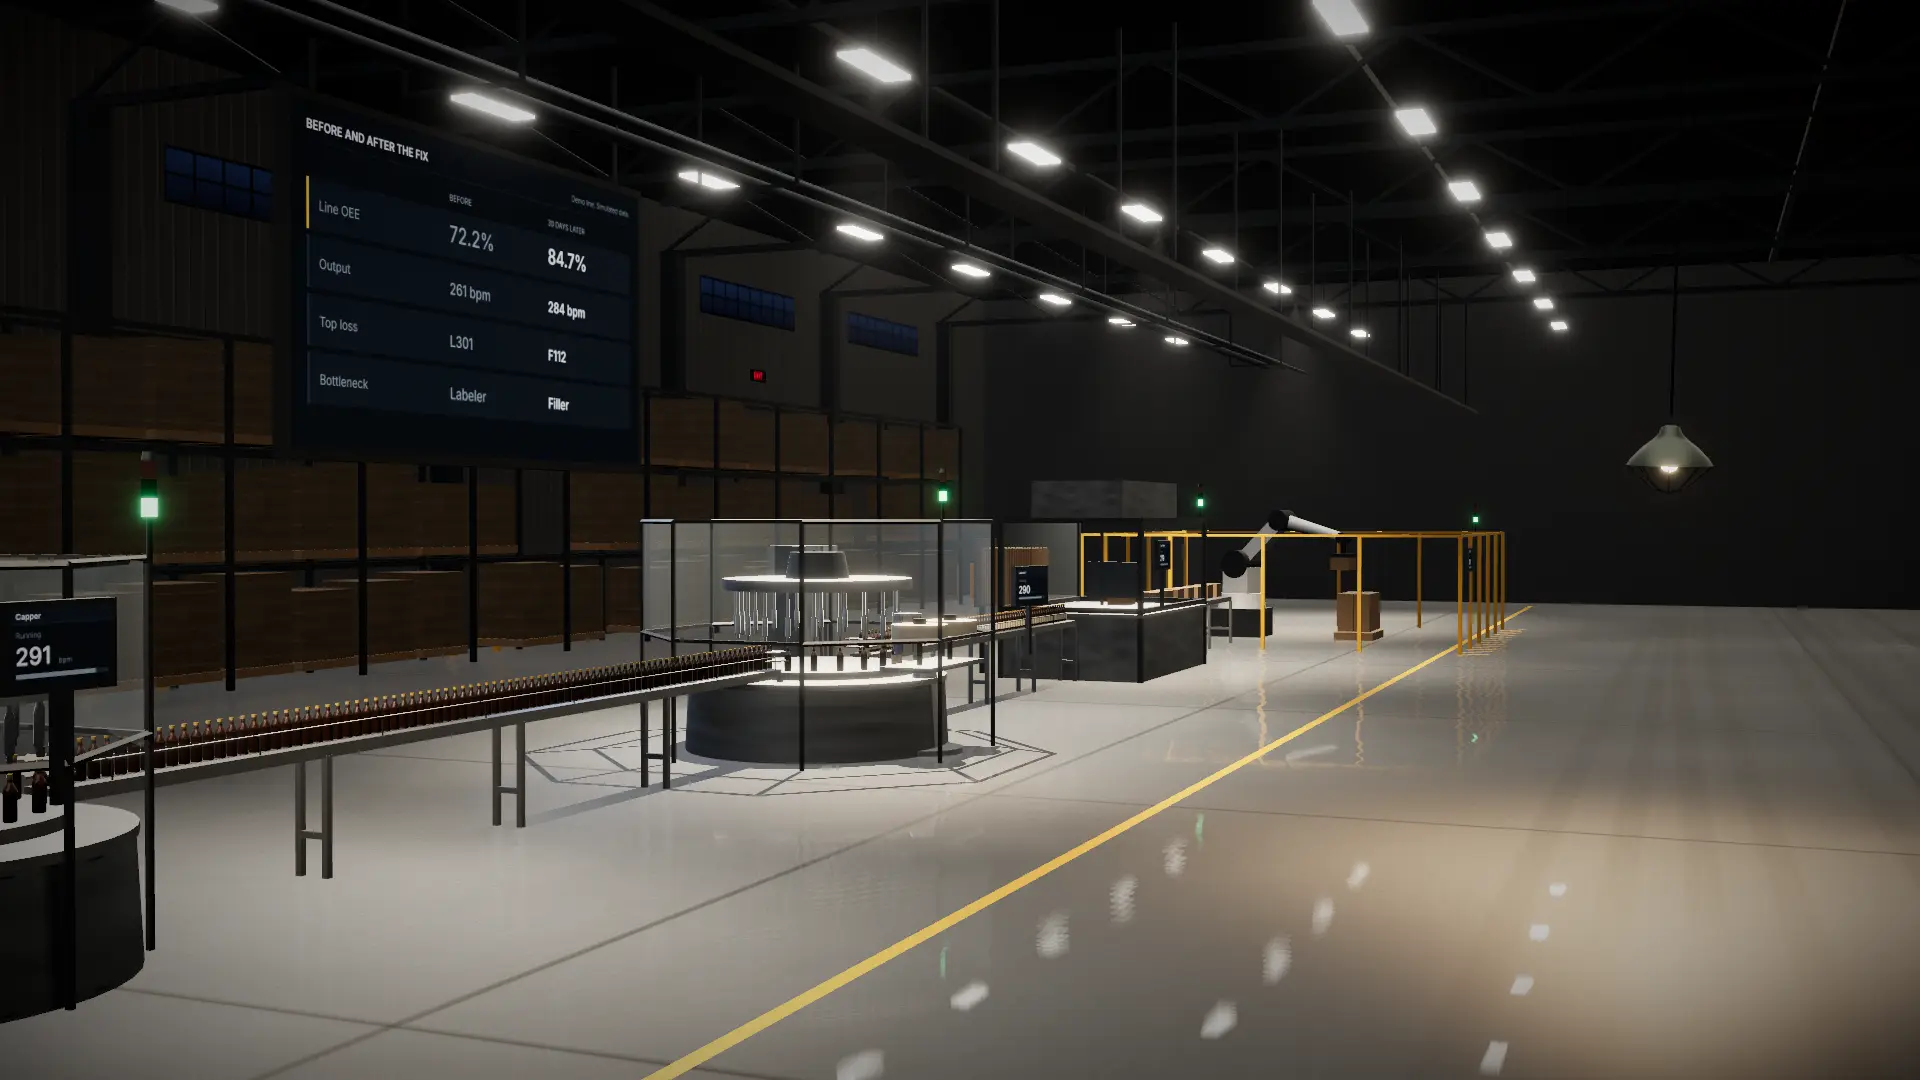
See the bottleneck, the machine that failed, and the stops that followed it.
S5 Software
See what your plant has been telling you.
Bottleneck: Labeler, set to 270 of 340 bpm.
Machines before it block. Machines after it starve.
From the floor, the whole line just went quiet.
The Filler now sets the pace. The next improvement is already on the board.
See your line clearly with Ignition-based dashboards and modules from S5 Modules.
Demo line. Simulated data.
The control room
Demo line. Simulated data.
See the bottleneck, the machine that failed, and the stops that followed it.
Compare 30 days of stops and focus on the fault responsible for the most downtime.
Compare output and OEE, then find the next machine setting the pace.
Change the machines and the story stays the same. One sets the pace, one fails first, and the rest stop with it.
OEE, last 60 min
Bottleneck
Labeler
First fault
None
Filler
Running
Capper
Running
Labeler
Running
Case Packer
Running
Palletizer
Running
All 5 machines running. Demo line. Simulated data.
Running something else? Tell us about your line.
We build Ignition-based dashboards and modules for the engineers who keep plants running.
AI
Create and refine Perspective views with AI inside the Designer, with project-aware chat.
See AI AssistantAI
A modern IDE for Ignition scripting, with Script Assistant and inline AI edits.
See Script IDEReady to use
Start from finished Ignition views instead of building every screen from scratch.
Browse S5 ModulesAI works only on what you request, and proposed changes need your approval before they are written.
Tell us about your dashboard or module needs and we'll reply with a clear next step.